Monitoring Step 2: Log Ingestion with Fluent Bit
With my last post completed, I now have a reasonably operational platform that can provide me with insight, alerting and dashboarding over events generated from my kubernetes cluster or from other sources.
That’s a great start, but I need to get the logs to this platform in a digestible form. Thankfully Kubernetes is a very well known platform and there are some well defined tools out there to use.
I’ve chosen to leverage Fluent Bit – considered a next generation implementation of fluentd that is quite light in its use of resources – and with my platform every bit of CPU and RAM counts.
Installing Fluent Bit
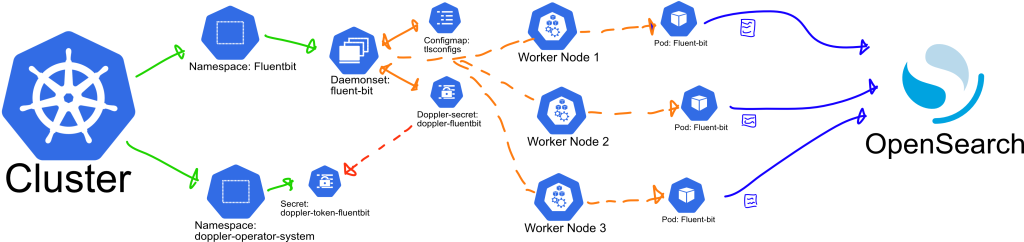
A daemonset will draw from configmap and secrets values and creatae a Fluent Bit pod in each worker node, outputting logs to Opensearch.
Some Configuration required
Fluent Bit offers a Helm chart for install which will require some modification as I’m going to need to inject some secrets and configs to the platform. At a minimum I need:
- To add the root ca certificate, not the key. If you recall from my last post, nothing should have the private key for your root (or intermediate) CA. The certificate is public so in this case I’m going to inject this as a configmap.
- A username and password for a user configured with enough access to Opensearch to:
- Create indexes
- Update indexes using the bulk and bulk* endpoint
- Some customisation to the configuration files of the Fluent Bit service. I want to configure the outputs to ship to Opensearch using both the above credentials and settings to ensure the logs are in the right shape and format.
Planning for Each Configuration Item
- The platform will exist in a dedicated namespace.
- The pure config items will go in a modified values file for the helm chart.
- The secrets will be delivered via doppler leveraging a new Doppler project and the Doppler Kubernetes Operator I’m also going to include the Opensearch Host and Port in the secret config. This is semi-sensitive data at best, but centralising the storage of this information is helpful at this stage. The Doppler Operator will keep these in sync and should notify pods/deployments when these values have changed.
Config Samples
fluentbit-doppler.yaml – this file assumes a pre-configured Doppler secrets operator and that we have also pre-configured a service token for the Doppler project. In this case I am expecting a secret named “doppler-token-fluentbit” within namespace doppler-operator-system connected to my Doppler project.
apiVersion: secrets.doppler.com/v1alpha1
kind: DopplerSecret
metadata:
  name: doppler-fluentbit # DopplerSecret Name
  namespace: doppler-operator-system
spec:
  tokenSecret: # Kubernetes service token secret (namespace defaults to doppler-operator-system)
    name: doppler-token-fluentbit
  managedSecret: # Kubernetes managed secret (will be created if does not exist)
    name: doppler-fluentbit
    namespace: fluentbit # Should match the namespace of deployments that will use the secret
    type: Opaque # Optional: defaults to `Opaque` so can be left out unless changed
tlsconfigs.yaml – when setting this up I had originally read this in as a raw file, but found that using key-value pairs was more friendly to mounting into the cluster. When using this approach the configmap or secret is mounted as a folder, and each key as a file containing its value. As a future exercise I may look to add this to my secrets file and mount this, but for now this works well.
kind: ConfigMap
apiVersion: v1
metadata:
  name: tlsconfigs
data:
  # Configuration values can be set as key-value properties
  myca.cert: |
    -----BEGIN CERTIFICATE-----
    ... some base64 certificate data.
    -----END CERTIFICATE-----
fluentbit-values.yaml – this file contains the customisations I’ve made to the helm chart for my implementation. The majority of this file is taken from the Fluent Bit values.yaml defaults hosted on github.
Key changes:
- Modified the Output targets to Opensearch, and configured the platform to read the user, password, host and host port secrets from doppler environment variables.
- Modified the log level to warn. You would generally set this to more verbose until the platform is stable.
- Mounted the root certificate in an appropriate location, and modified the Output configs to be aware of this and to use TLS and ensure they validate against this root cert when connecting.
- I’ve also tweaked the output buffer size after encountering a warning with the default configuration – this may require revisiting as there appears to be some ongoing discussion as to where the root cause of this particular warning lies.
kind: DaemonSet
replicaCount: 1
image:
  repository: cr.fluentbit.io/fluent/fluent-bit
  tag: 2.2.2
  digest:
  pullPolicy: Always
testFramework:
  enabled: true
  namespace:
  image:
    repository: busybox
    pullPolicy: Always
    tag: latest
    digest:
imagePullSecrets: []
nameOverride: ""
fullnameOverride: ""
serviceAccount:
  create: true
  annotations: {}
  name:
rbac:
  create: true
  nodeAccess: false
  eventsAccess: false
podSecurityPolicy:
  create: false
  annotations: {}
openShift:
  enabled: false
  securityContextConstraints:
    create: true
    name: ""
    annotations: {}
    existingName: ""
podSecurityContext: {}
hostNetwork: false
dnsPolicy: ClusterFirst
dnsConfig: {}
hostAliases: []
securityContext: {}
service:
  type: ClusterIP
  port: 2020
  loadBalancerClass:
  loadBalancerSourceRanges: []
  labels: {}
  annotations: {}
serviceMonitor:
  enabled: false
  additionalEndpoints: []
prometheusRule:
  enabled: false
dashboards:
  enabled: false
  labelKey: grafana_dashboard
  labelValue: 1
  annotations: {}
  namespace: ""
lifecycle: {}
livenessProbe:
  httpGet:
    path: /
    port: http
readinessProbe:
  httpGet:
    path: /api/v1/health
    port: http
resources: {}
ingress:
  enabled: false
  ingressClassName: ""
  annotations: {}
  hosts: []
  extraHosts: []
  tls: []
autoscaling:
  vpa:
    enabled: false
    annotations: {}
    controlledResources: []
    maxAllowed: {}
    minAllowed: {}
    updatePolicy:
      updateMode: Auto
  enabled: false
  minReplicas: 1
  maxReplicas: 3
  targetCPUUtilizationPercentage: 75
  customRules: []
  behavior: {}
podDisruptionBudget:
  enabled: false
  annotations: {}
  maxUnavailable: "30%"
nodeSelector: {}
tolerations: []
affinity: {}
labels: {}
annotations: {}
podAnnotations: {}
podLabels: {}
minReadySeconds:
terminationGracePeriodSeconds:
priorityClassName: ""
env:
  - name: FLUENTBIT_PWD
    valueFrom:
      secretKeyRef:
        name: doppler-fluentbit
        key: FLUENTBIT_PWD
  - name: FLUENTBIT_USER
    valueFrom:
      secretKeyRef:
        name: doppler-fluentbit
        key: FLUENTBIT_USER
  - name: OPENSEARCH_HOST
    valueFrom:
      secretKeyRef:
        name: doppler-fluentbit
        key: OPENSEARCH_HOST
  - name: OPENSEARCH_PORT
    valueFrom:
      secretKeyRef:
        name: doppler-fluentbit
        key: OPENSEARCH_PORT
envWithTpl: []
envFrom: []
extraContainers: []
flush: 1
metricsPort: 2020
extraPorts: []
extraVolumes:
  - name: tlsconfigs
    configMap:
      name: tlsconfigs
    type: FileOrCreate
extraVolumeMounts:
  - name: tlsconfigs
    mountPath: /etc/ssl/myca
    readOnly: true
updateStrategy: {}
existingConfigMap: ""
networkPolicy:
  enabled: false
luaScripts: {}
config:
  service: |
    [SERVICE]
        Daemon Off
        Flush {{ .Values.flush }}
        Log_Level {{ .Values.logLevel }}
        Parsers_File /fluent-bit/etc/parsers.conf
        Parsers_File /fluent-bit/etc/conf/custom_parsers.conf
        HTTP_Server On
        HTTP_Listen 0.0.0.0
        HTTP_Port {{ .Values.metricsPort }}
        Health_Check On

  inputs: |
    [INPUT]
        Name tail
        Path /var/log/containers/*.log
        multiline.parser docker, cri
        Tag kube.*
        Mem_Buf_Limit 5MB
        Skip_Long_Lines On
    [INPUT]
        Name systemd
        Tag host.*
        Systemd_Filter _SYSTEMD_UNIT=kubelet.service
        Read_From_Tail On
  filters: |
    [FILTER]
        Name kubernetes
        Match kube.*
        Merge_Log On
        Keep_Log Off
        K8S-Logging.Parser On
        K8S-Logging.Exclude On
  outputs: |
    [OUTPUT]
        Name opensearch
        Match kube.*
        Host ${OPENSEARCH_HOST}
        Port ${OPENSEARCH_PORT}
        Suppress_Type_Name On
        Replace_Dots    On
        HTTP_User ${FLUENTBIT_USER}
        HTTP_Passwd ${FLUENTBIT_PWD}
        tls.ca_file /etc/ssl/myca/myca.cert
        tls On
        tls.verify On
        Buffer_Size 256KB
        Logstash_Format On
        Retry_Limit False
        Trace_Error       On
    [OUTPUT]
        Name opensearch
        Match host.*
        Host ${OPENSEARCH_HOST}
        Port ${OPENSEARCH_PORT}
        Suppress_Type_Name On
        Replace_Dots    On
        HTTP_User ${FLUENTBIT_USER}
        HTTP_Passwd ${FLUENTBIT_PWD}
        tls.ca_file /etc/ssl/myca/myca.cert
        tls On
        tls.verify On
        Buffer_Size 256KB
        Logstash_Format On
        Logstash_Prefix node
        Retry_Limit False
        Trace_Error       On
  upstream: {}
  customParsers: |
    [PARSER]
        Name docker_no_time
        Format json
        Time_Keep Off
        Time_Key time
        Time_Format %Y-%m-%dT%H:%M:%S.%L
  extraFiles: {}
volumeMounts:
  - name: config
    mountPath: /fluent-bit/etc/conf
daemonSetVolumes:
  - name: varlog
    hostPath:
      path: /var/log
  - name: varlibdockercontainers
    hostPath:
      path: /var/lib/docker/containers
  - name: etcmachineid
    hostPath:
      path: /etc/machine-id
      type: File
daemonSetVolumeMounts:
  - name: varlog
    mountPath: /var/log
  - name: varlibdockercontainers
    mountPath: /var/lib/docker/containers
    readOnly: true
  - name: etcmachineid
    mountPath: /etc/machine-id
    readOnly: true
command:
  - /fluent-bit/bin/fluent-bit
args:
  - --workdir=/fluent-bit/etc
  - --config=/fluent-bit/etc/conf/fluent-bit.conf
initContainers: []
logLevel: warn
hotReload:
  enabled: false
  image:
    repository: ghcr.io/jimmidyson/configmap-reload
    tag: v0.11.1
    digest:
    pullPolicy: IfNotPresent
  resources: {}
Deploying and Validating the Installation
From this point, deploying to the cluster is relatively straight forward. Assuming Helm is already up and running and I have added the appropriate source of Helm charts as described in the Fluent Bit documentation, the following commands should set everything up:
kubectl create namespace fluentbit
kubectl apply --namespace fluentbit -f tlsconfigs.yaml
kubectl apply --namespace fluentbit -f fluentbit-dopler.yaml
helm upgrade --install fluent-bit fluent/fluent-bit --namespace fluentbit -f fluentbit-values.yaml
The above helm command is friendly to re-apply, so if any changes are required, I can adjust fluentbit-values.yaml and re-run that line.
Once up and running I can check on the daemonset and pods with the following commands:
kubectl get daemonset --namespace fluentbit
kubectl get pods --namespace fluentbit
Or inspect an individual pod for any warnings or errors:
kubectl logs --namespace fluentbit <pod-name>Of course the true test is whether these logs actually reach opensearch. What I should see is the creation of two indexes per day:
- logstash-YYYY.MM.DD
- node-YYYY.MM.DD
Thankfully that appears to be working as required:
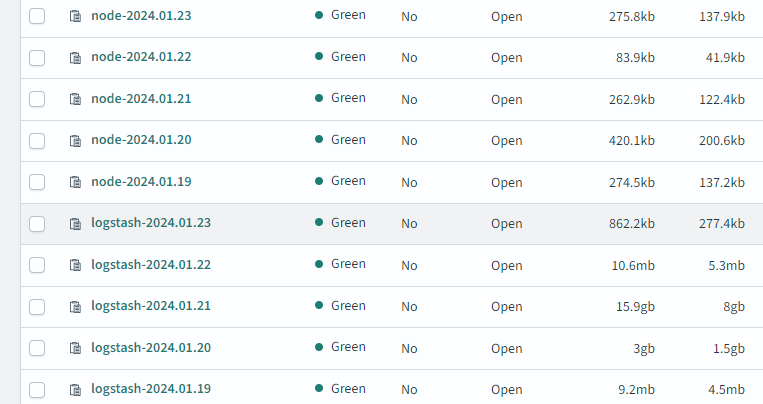
The excess of logs on Jan 20th and Jan 21st are as a result of leaving the fluentd log level in debug mode – which certainly assisted in a stress test of the platform itself. With the indexes now active, this has allowed me to create a few very basic dashboards for early insight on the platform.
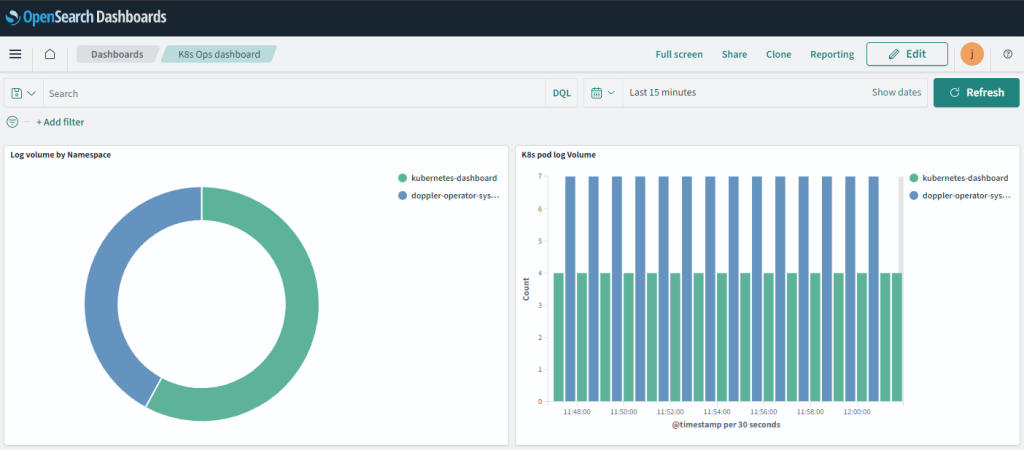
What the above dashboards suggest to me at an initial glance is that both of the namespaces generating logs require a deeper look. If there’s nothing awry then perhaps the verbosity of the logs could be reduced.
A few quick thoughts on Security
Is this Secure?
This is secure enough for my purposes of internal development use.
I would not consider this anywhere near secure enough to expose to the internet or to leverage against a production cluster.
While not a complete list, some additional steps that should be considered for a more critical or openly accessible environment would be:
- Encryption of data at rest:
- On your worker nodes – as there’s no point hardening the remainder of the journey if the origin is unencrypted.
- In fluentd if you are using filesystem buffering.
- More importantly in Opensearch for longer term storage.
- Additional logic in fluent-bit and/or opensearch to warn or reject data that could be considered in breach of your organisational expectations on log data. Some examples would be GDPR personal data, PI data, or payment information that should not be retained/stored.
- Consider using mutual TLS authentication instead of usernames and passwords for authentication to opensearch.
- Limit who can access the Opensearch endpoint with additional security layers. Some options:
- VPN tunneling
- An API gateway with its own pre-authentication requirements.
- Change the setup so Fluent Bit is not responsible for creating new indexes, or set up a middleware implementation of Fluent Bit responsible for this in a more secured location, limiting what a malicious actor could do if they obtained the Fluent Bit credentials that are leveraged by the cluster.
- Within the kubernetes cluster, introduce egress controls that only allow outbound connections from fluent-bit to your opensearch container (generally a good idea for any outbound traffic).
What is Next?
There is plenty of work ahead here but with the logs ingesting I can now move on to more detailed monitoring, analytics and alerting. I hope to be able to build out much more detailed insight than my simple dashboard above provides, and also introduce some alerting to some key applications present on the cluster.