Monitoring Step 1: Setting up a Log Aggregation Platform
Getting a cluster up and running is a great first step, but from here on out I’m going to need access to various log sources as I work to puzzle out what is working well and what needs attention on the cluster. It would also be handy to be able to build alerts that can give me a warning if things are not working as they should.
As part of building out the cluster I had selected OpenSearch as a starting point for centralized logging, reporting, dashboarding and alerting.
There are a lot of great SaaS products out there that provide additional functionality and control and a production cluster this would be a no-brainer, I would go with a 3rd party that does this stuff as their core business, and would then focus on developing the platform platform.
For a development cluster things get a little trickier. For starters, development clusters generate a lot of logs. These are where we turn all the extra toggles on when something doesn’t work to inspect the output, and occasionally forget to turn those toggles back off.
Organisations tend to be a lot more sensitive to cost in these lower environments, but there is a fundamental challenge here. Developers often require detailed insight at the lower environment level in order to detect, address and avoid unexpected issues in production environments.
So while we probably should use the full-featured platforms for monitoring of development environments, it is common to leverage something a bit more ‘volume-friendly’ in a dev cluster, avoiding rather uncomfortable conversations with management and finance teams as to why the monthly fee for your monitoring platform suddenly jumped by an order of magnitude.
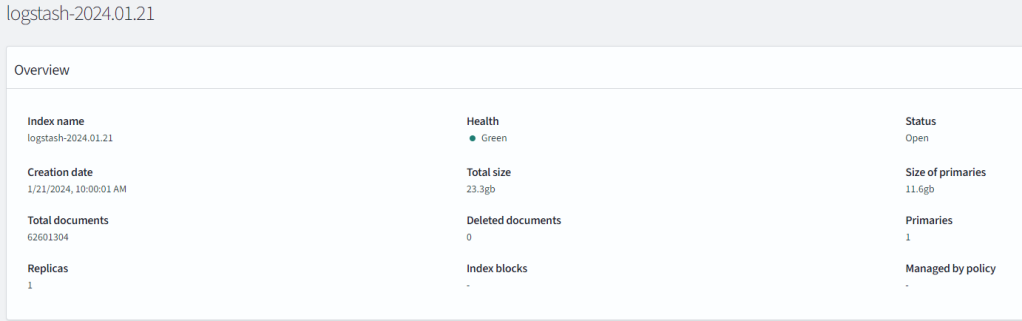
An unoptimized dev cluster: cluster logs for half a day producing over 12GB of data and volume of over 62 million discrete messages. As an example, the above image represents my OpenSearch index for all the worker nodes and apps in my cluster, where only half a day of log data produced over 12GB of data. The underlying cause was likely due to a debug switch I had left active on a particular application.
OpenSearch
OpenSearch is the open source fork of ElasticSearch and Kibana – an extremely popular platform combining some key features that I hope to leverage to monitor the platform:
- Ingest and storage of time-series data.
- Indexing services for this data – enabling powerful searches and detailed inspection.
- Dashboarding and visualization tools.
- Monitoring and alerting features.
As a data platform OpenSearch requires a bit more power than I can typically provide on the small Raspberry Pi units, so for now this will reside on a docker compose configuration on my management system hosted on the same network as the cluster:
Loading a Demo Instance
Following the instructions in the quickstart guide for OpenSearch proves out that the hardware I have is feasible for this deployment – the web UI is responsive and with the addition of a 1TB solid state drive I have enough storage for at least a small volume of log data and making a few small tweaks to the compose file seems to work well:

Configuring and Securing OpenSearch
This section is my summary and experiences while following the guidelines from:
- https://opensearch.org/docs/latest/install-and-configure/install-opensearch/docker/
- https://opensearch.org/docs/latest/security/configuration/index/ The demo while tempting to leverage because it is live, is also incredibly insecure. All the provided credentials are well known and the first steps for security guide in the documentation can be paraphrased as “Don’t do this”.
So as a first step I’ll need to roll my own.
This starts with the generation of certificates and is often where things get a little tricky. OpenSSL is a great toolset but does require some understanding of what is going on to get the right output. On top of this OpenSearch leverages Java as its runtime – which typically adds an extra layer of complexity as Java opts not to derive certificate data from the underlying operating system, but instead manages its own certificate infrastructure.
Thankfully it looks like I don’t have to create my own keystore this time.
By default, OpenSearch uses certificates for:
- Node-to-Node communication
- Administration of the platform – particularly in initial setup where a security script needs to be invoked.
- Providing TLS encryption for the OpenSearch-dashboards interface
- Optionally as an authentication mechanism for OpenSearch clients to the back-end service. At this stage it appears that authentication to the OpenSearch-Dashboards front end does not provide this as an authentication mechanism.
In addition to certificate setup, we’ll also need to define how users authenticate, what roles and permissions each user should have, and whether users are managed internal to the platform or as part of an external user directory.
For my configuration I’ll keep this fairly simple:
The default admin account will be renamed and issued new credentials.
- I will use the internal user database as I don’t have a viable alternative right now.
- Pretty much all other roles/services will be created through the UI once the platform is up and running.
- All secrets (certificate keys, user passwords) should be stored in and provided by Doppler secrets manager if at all possible.
- While not required from a security standpoint, for ease of configuration, the public certificates will also be stored in Doppler.
Basic Cert guidelines
The instructions provided on the OpenSearch page provide a handy script for generating self-signed certificates, but having worked with certificates across a variety of sites and services there’s some additional tips I’d like to add here:
- If your organization has well-established PKI infrastructure, consider using that first. There is likely additional rigor and controls in this process that will help you in the long run.
- Consider upping the encryption defaults – especially if you are considering exposing anything to a public or public adjacent space.
- Get familiar with both the forward and backwards representation of certificates. For example:
/C=CA/ST=ONTARIO/L=TORONTO/O=ORG/OU=UNIT/CN=node2.dns.a-recordis equivalent to:CN=node2.dns.a-record,OU=UNIT,O=ORG,L=TORONTO,ST=ONTARIO,C=CA - While Nodes do not require any additional Certificate data, any certificate attached to a web host should have at least a subject name and potentially any alternative names that match the site (short DNS names and IP addresses).
- Test your certificates and ensure what you think they contain is what they actually contain. For example:
openssl x509 -in client.pem -noout -text | grep DNSwould indicate whether the client.pem certificate intended for OpenSearch-dashboards has appropriate DNS records as subject alternate names. - Nothing needs your root ca key. You should only ever use this for generating new certs. Once you’ve done that, consider storing this offline, or in a dedicated vault with extremely limited access.
- Certificates are public, keys are private. There’s no harm in storing certificates in a secured space, but please don’t do the reverse and store keys in a public or semi public place.
Doppler Secrets Setup
Ideally I would have preferred to leverage doppler’s file templating system to host all certificates, but as doppler can only produce one file per call, I have instead opted to generate the OpenSearch-dashboards as a template, and instead temporarily create the certificate files using injection from environment variables. This isn’t quite as clean as I’d like, but still limits exposure significantly:
###OpenSearch-Dashboards-template (I should use variables for the nodes as well for a truly clean setup).
opensearch.hosts: ["https://node1:9200","https://node2:9200"]
opensearch.ssl.verificationMode: full
opensearch.username: "{{.KIBANA_USER}}"
opensearch.password: "{{.KIBANA_PWD}}"
opensearch.requestHeadersAllowlist: [ authorization,securitytenant ]
server.ssl.enabled: true
server.host: "0.0.0.0"
server.ssl.certificate: /run/secrets/client_cert
server.ssl.key: /run/secrets/client_cert_key
server.ssl.certificateAuthorities: [ "/run/secrets/root_cert" ]
opensearch.ssl.certificateAuthorities: [ "/run/secrets/root_cert" ]
opensearch_security.multitenancy.enabled: true
opensearch_security.multitenancy.tenants.preferred: ["Private", "Global"]
opensearch_security.readonly_mode.roles: ["kibana_read_only"]
opensearch_security.cookie.secure: true
###Doppler command chain. This uses two invocations of doppler as this appears to be the cleanest way to get both a template file and the required environment variables.
        --mount custom-opensearch-dashboards.yml \
        --mount-template doppler_templates/custom-opensearch-dashboards.yml.tmpl \
        --command $<logic to generate certs and start docker containers as a foreground service here>
Running as a Systemd Service:
As part of ensuring this platform stays up, I’ve built a basic systemd service that calls doppler to inject secrets and cleans up the temporary certificates as part of shutdown.
[Unit]
Description=%i service with docker compose
PartOf=docker.service
After=docker.service

[Service]
Type=exec
WorkingDirectory=/home/<opensearch-user>/opensearch
ExecStart=/home/<opensearch-user>/opensearch/start-opensearch.sh
ExecStop=/home/<opensearch-user>/opensearch/stop-opensearch.sh
User=<opensearch-user>
Group=<opensearch-user>

[Install]
WantedBy=multi-user.target
Connecting to the Dashboards website
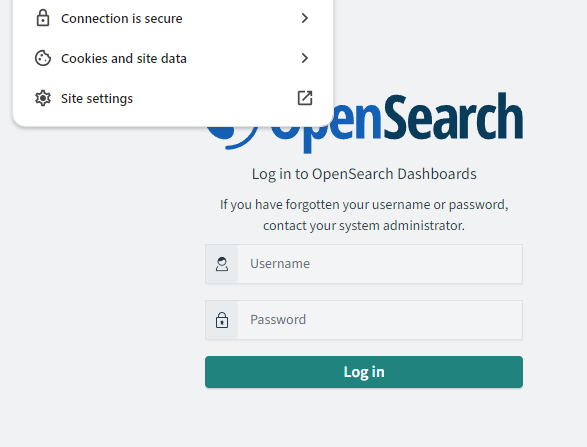
Once the system is up and reporting as ready, the dashboards service can be connected to via HTTPS on port 5601, however at this point we will still receive security errors as even though the certificate is correct, our client doesn’t trust the root certificate that issued this certificate.
To fix this we install the root certificate (not the key) into the trusted root certificates of either our system or our user space.
- Windows instructions
- OS X instructions (may need to install the certificate first)
- Ubuntu Instructions
From there, as long as your certificates and docker compose mappings are all configured correctly, you should see a secured connection:
How Secure is this Setup?
Honestly, it’s not great yet.
This is an experimental platform though and given the existing platform level security and limitations around access, this will suffice for dev cluster purposes for the near term.
We have encrypted traffic, and have secured access to the platform by removing well known credentials but I would not be confident exposing this application stack to the public internet.
Improved Security Checklist
This is by no means an exhaustive list, but would be a good starting point for further hardening activities.
- The OpenSearch platform should be in a dedicated network behind a firewall and with monitoring controls in place.
- Connections to OpenSearch-Dashboards should be proxied via a HTTP-aware reverse proxy. This could also contain additional authentication logic.
- Connections to the OpenSearch platform should be proxied via an API Gateway or VPN ideally leveraging an additional authentication mechanism to prevent access to the back-end service without an additional authentication token, certificate or other mechanism.
##What is Next? Now that I have a working platform, I need to ensure that I am feeding it the data I want to inspect and monitor. I’ll be covering setup of fluentbit across the cluster in an upcoming post.